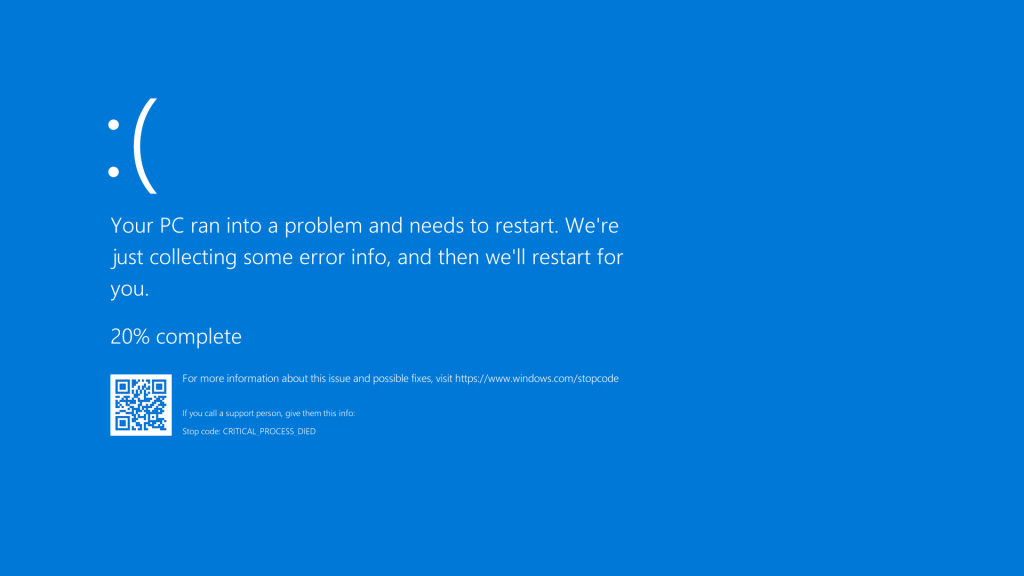
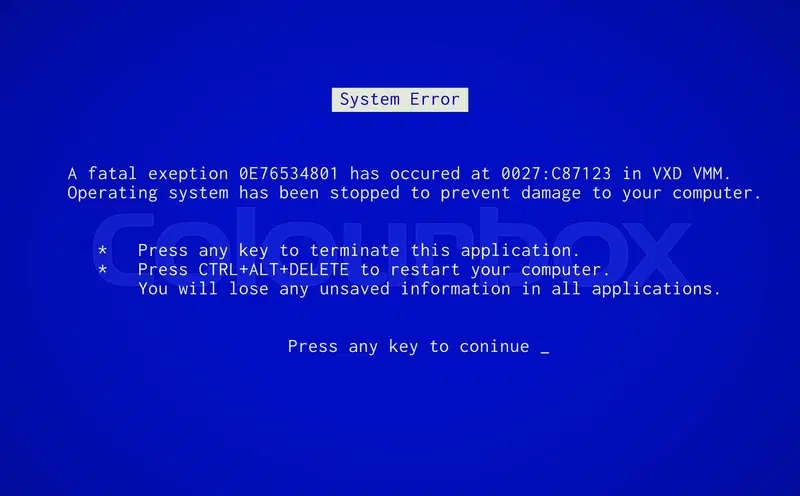
Experiencing a Windows Blue Screen of Death (BSOD) can be frustrating, often signaling a critical system error that disrupts your workflow. These crashes, marked by a sudden blue screen with error codes, can stem from hardware failures, driver issues, or software conflicts. Understanding the root cause is essential to prevent future occurrences and maintain a stable system.
BlueScreenView, a free utility from NirSoft, simplifies the process of analyzing BSOD crashes. It provides a user-friendly interface to examine minidump files generated during a crash, offering insights into the drivers, processes, and error codes involved. This tool empowers users, from novices to IT professionals, to diagnose and resolve system issues effectively.
This article explores how BlueScreenView works, its key features, and practical steps to use it for diagnosing BSOD errors. By understanding its capabilities, you can troubleshoot crashes, identify problematic drivers, and enhance your Windows system’s reliability. Let’s dive into how BlueScreenView transforms complex crash data into actionable solutions.
Understanding BlueScreenView and Its Purpose
What Is BlueScreenView?
BlueScreenView is a lightweight, free tool developed by NirSoft to analyze Windows crash dump files. It scans minidump files created during BSOD events and presents detailed information in an accessible format. Users can view error codes, driver details, and crash timelines without needing advanced technical knowledge. Its simple interface makes it a go-to solution for diagnosing system crashes. The tool supports Windows XP through Windows 11.
Why Analyze BSOD Crashes?
BSOD crashes indicate serious system issues, such as faulty hardware, corrupt drivers, or software conflicts. Identifying the cause prevents recurring crashes that disrupt productivity or cause data loss. BlueScreenView helps pinpoint the exact driver or module responsible, saving time and effort. Without proper analysis, unresolved issues may lead to system instability. Analyzing crashes ensures a smoother, more reliable computing experience.
How BlueScreenView Accesses Minidump Files
When a BSOD occurs, Windows generates a minidump file containing crash details, typically stored in the C:\Windows\Minidump folder. BlueScreenView automatically scans this directory to load and display minidump data. It extracts critical information like bug check codes, parameters, and involved drivers. Users can view this data in a structured table format. This accessibility simplifies troubleshooting for all skill levels.
Installing and Setting Up BlueScreenView
Downloading BlueScreenView Safely
BlueScreenView is available for free on NirSoft’s official website. Always download from this trusted source to avoid malware or counterfeit versions. The tool requires no installation, as it runs as a portable executable. Ensure your system meets the minimum requirements, such as Windows XP or later. Verify the file’s integrity using a checksum if needed.
Configuring Windows for Minidump Creation
To use BlueScreenView effectively, Windows must be set to generate minidump files during crashes. Access System Properties via Control Panel, navigate to the Advanced tab, and click Settings under Startup and Recovery. Select “Small memory dump (256 KB)” and confirm the dump file location (default: %SystemRoot%\Minidump). This ensures BlueScreenView has data to analyze. Restart your system if changes are made.
Launching BlueScreenView for the First Time
After downloading, extract the BlueScreenView ZIP file and run the executable. The tool automatically scans the default minidump folder and lists available crash dumps. No additional setup is required, making it beginner-friendly. Ensure you have administrative privileges to access minidump files. The interface displays crashes chronologically, ready for analysis.
Key Features of BlueScreenView for BSOD Analysis
Detailed Crash Dump Reports
BlueScreenView generates comprehensive reports from minidump files, displaying crash dates, times, and error codes. It lists the bug check string (e.g., IRQL_NOT_LESS_OR_EQUAL) and parameters, helping identify the crash’s nature. The tool highlights drivers likely responsible for the crash in red. Users can export these reports as text or HTML files. This feature streamlines detailed troubleshooting and documentation.
Driver and Module Information
BlueScreenView provides a lower pane view showing drivers and modules loaded during a crash. It highlights problematic drivers, helping users focus on potential culprits. Key details include driver names, addresses, and timestamps. This information is critical for identifying outdated or faulty drivers. Users can cross-reference this data with driver updates or known issues.
Customizable Interface and Filters
The tool offers a customizable interface to enhance usability. Users can sort crash dumps by date, error code, or driver name. Filters allow focusing on specific crashes or drivers, reducing clutter. Options like “Highlight Drivers” and “Show Stack” improve visibility of critical data. This flexibility suits both casual users and advanced technicians.
Step-by-Step Guide to Analyzing BSOD with BlueScreenView
Loading and Reviewing Minidump Files
- Open BlueScreenView to automatically load minidump files from the default folder.
- Select a specific crash dump from the upper pane to view its details.
- Note the crash date, time, and bug check string for context.
- Check the lower pane for drivers marked in red, indicating potential causes.
- Save the dump details for further analysis or sharing with support teams.
Interpreting Bug Check Codes
Bug check codes, or stop codes, are key to understanding BSOD causes. BlueScreenView displays these codes (e.g., 0x0000000A) alongside their descriptions. Research the code online using Microsoft’s documentation or forums for specific fixes. Parameters listed provide additional context, such as memory addresses involved. Cross-referencing codes with driver data narrows down the issue.
Identifying Problematic Drivers
BlueScreenView highlights drivers likely causing the crash in the lower pane. Note the driver’s name (e.g., nvlddmkm.sys for NVIDIA) and version. Search for known issues with the driver online or check the manufacturer’s website for updates. Updating or rolling back the driver often resolves the issue. If unsure, consult a professional or use automated driver update tools.
Common BSOD Causes BlueScreenView Can Identify
Hardware-Related Issues
- Faulty RAM or hard drives often trigger BSODs, detected via memory-related error codes.
- Overheating components, like CPUs or GPUs, may cause crashes, identifiable by specific stop codes.
- Loose hardware connections can lead to system instability, reflected in minidump data.
- BlueScreenView’s error code analysis helps pinpoint hardware issues for further testing.
- Use tools like MemTest86 or CrystalDiskInfo alongside BlueScreenView for confirmation.
Driver Conflicts and Errors
- Outdated or corrupt drivers are common BSOD culprits, often highlighted in BlueScreenView.
- Newly installed drivers may conflict with existing ones, causing system crashes.
- Incompatible drivers for hardware upgrades can trigger errors like DRIVER_IRQL_NOT_LESS_OR_EQUAL.
- BlueScreenView identifies the specific driver file, guiding users to update or remove it.
- Regular driver updates from manufacturers prevent recurring issues.
Software and System File Corruption
- Corrupted system files, often from malware or improper shutdowns, can cause BSODs.
- Third-party software, like antivirus or VPNs, may conflict with Windows processes.
- BlueScreenView’s module list reveals software-related crashes by highlighting involved files.
- Running System File Checker (SFC) or DISM can fix corrupted files post-analysis.
- Uninstalling problematic software identified by BlueScreenView resolves many crashes.
Best Practices for Using BlueScreenView Effectively
Regular Monitoring and Maintenance
- Check BlueScreenView periodically to catch recurring crash patterns early.
- Keep Windows and drivers updated to minimize BSOD occurrences.
- Back up minidump files before modifying system settings for future reference.
- Use BlueScreenView alongside Event Viewer for a comprehensive system health check.
- Document crash details for consistent troubleshooting across multiple incidents.
Combining BlueScreenView with Other Tools
BlueScreenView excels at analyzing minidumps but works best with complementary tools. Use WhoCrashed for automated BSOD analysis or WinDbg for advanced debugging. MemTest86 helps diagnose RAM issues, while CrystalDiskInfo checks drive health. Combining these tools provides a holistic view of system stability. Cross-reference BlueScreenView’s findings with these tools for accurate diagnosis.
Seeking Professional Help When Needed
If BlueScreenView identifies complex issues like hardware failures or persistent crashes, professional assistance may be required. Share BlueScreenView’s exported reports with technicians for faster diagnosis. Online forums like Microsoft Community or Reddit’s tech support can offer guidance. Avoid modifying critical system files without expertise. Professional help ensures safe resolution of intricate BSOD causes.
Conclusion
BlueScreenView is an invaluable tool for diagnosing Windows Blue Screen of Death errors, offering a clear, user-friendly way to analyze minidump files. By identifying faulty drivers, error codes, and system issues, it empowers users to troubleshoot crashes effectively. Whether you’re a beginner or an IT expert, BlueScreenView simplifies the process, helping maintain a stable system. Leverage its features, combine with other tools, and address BSOD causes confidently to ensure optimal PC performance.


