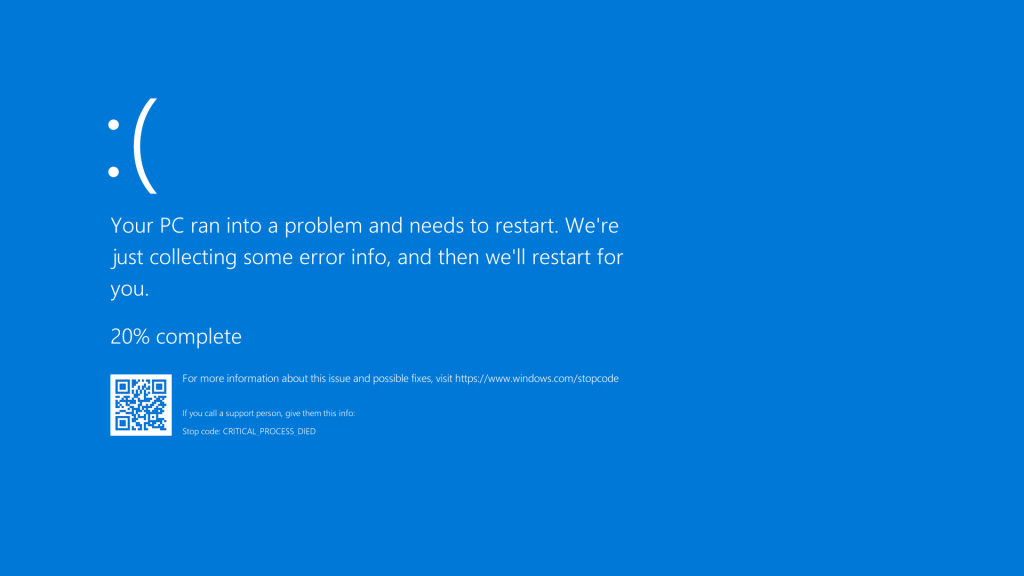
Windows users often encounter the dreaded Blue Screen of Death (BSOD), which indicates a serious system error. While frustrating, these crash events create memory dump files that contain critical data about what went wrong. Analyzing this data is essential for diagnosing errors, fixing system issues, and preventing future crashes.
One of the most widely used tools for reading these dump files is BlueScreenView, a lightweight program developed by NirSoft. It provides a simple, user-friendly interface that allows users to quickly understand BSOD errors without requiring advanced technical expertise. By displaying detailed crash reports in a structured format, BlueScreenView empowers both IT professionals and regular users to detect driver issues, system faults, or hardware failures.
The tool’s interface is divided into two panes the upper pane and the lower pane. Each pane provides unique information, serving a different role in troubleshooting. Understanding the difference between them is key to effectively interpreting crash reports and fixing the underlying causes of system instability.
Structure of the BlueScreenView Interface
Upper Pane Overview
The upper pane displays a list of all recorded crash dump files on the system. Each entry corresponds to a BSOD incident, complete with essential metadata. It helps users identify when the crashes occurred and the basic parameters of each event.
Lower Pane Overview
The lower pane complements the upper pane by showing detailed information about the modules or drivers involved in the selected crash. It allows users to drill deeper into the root cause.
Importance of Two Panes
The two-pane structure ensures a balance between overview and detail. While the upper pane highlights broad patterns, the lower pane reveals precise technical data necessary for effective troubleshooting.
Functions of the Upper Pane
Crash Dump Listing
The upper pane lists all available minidump files detected in the default Windows crash folder. Users can quickly scroll through them and choose which incident to investigate further.
Columns and Data Fields
Information in the upper pane includes bug check codes, parameters, crash time, and suspected drivers. These columns provide a snapshot of each crash’s key attributes.
Identifying Patterns
By reviewing multiple crash entries in the upper pane, users can detect recurring errors or problematic drivers. This helps in spotting systematic issues within the system.
- Provides quick timeline of crashes
- Displays bug check codes and parameters
- Lists suspected drivers for fast analysis
- Allows comparison across multiple dumps
- Helps identify recurring error trends
Functions of the Lower Pane
Detailed Driver Involvement
The lower pane breaks down the modules and drivers involved in the selected crash. It pinpoints which drivers were active and potentially caused the error.
Technical Information Provided
Details include driver file names, addresses, memory load location, and product information. This deeper data helps advanced users or technicians troubleshoot at the code and system level.
Linking Causes to Solutions
Once the lower pane reveals driver names, users can decide whether to update, roll back, or uninstall drivers. This connection between cause and solution is central to BSOD troubleshooting.
Comparison of the Two Panes
General vs Specific
The upper pane provides general crash information while the lower pane zooms into specifics about system files and drivers. Together, they offer both high-level and low-level perspectives.
User Experience Benefits
Having two panes side by side makes navigation intuitive. Users can quickly move from one crash overview to its corresponding technical breakdown without switching tools.
Efficiency in Troubleshooting
The upper pane helps users select incidents, while the lower pane explains the causes. This streamlined workflow shortens troubleshooting time and reduces system downtime.
- Upper pane = overview of crash dumps
- Lower pane = technical driver details
- Both work together for accurate diagnosis
- Provides layered data for all expertise levels
- Improves troubleshooting efficiency significantly
Practical Uses of BlueScreenView Panes
For IT Professionals
System administrators can use both panes to detect failing drivers, assess system health, and document recurring BSOD issues across multiple computers.
For Regular Users
Non-technical users benefit from the straightforward upper pane, which highlights suspected files and codes. This allows them to research solutions or seek help online.
For Troubleshooting Strategies
Using both panes together enables effective strategies such as driver updates, hardware testing, or system restoration. Without this dual structure, problem-solving would be less precise.
- IT professionals gain diagnostic depth
- Regular users get easy-to-read summaries
- Supports structured troubleshooting plans
- Offers guidance on driver updates
- Aids in long-term system stability
Key Differences Summarized
Upper Pane Focus
The upper pane is primarily about presenting crash dump entries in an organized list, making it easier to browse and identify issues at a glance.
Lower Pane Focus
The lower pane shifts the focus to the technical details of drivers and modules, enabling targeted troubleshooting and deeper insights into crashes.
Combined Value
Together, the panes provide a complete picture: the upper pane directs attention to crash events, while the lower pane supplies the evidence required for corrective action.
Conclusion
The upper and lower panes in the BlueScreenView interface serve distinct but complementary roles. The upper pane offers a broad overview of crash dumps, helping users identify when and how crashes occurred. The lower pane provides detailed driver and module information, allowing deeper analysis of system faults. Used together, they form a complete diagnostic environment that empowers both professionals and regular users to troubleshoot BSOD errors effectively and maintain system stability.